Stat 200 Syllabus Spring 2020
| Instructors | L1 and Online: Ellen Fireman Email: fireman@illinois.edu S1: Alton Barbehenn Email: barbehe2@illinois.edu S2: Changbo Zhu Email: changbo2@illinois.edu S3: Yihe Wang Email: ywang426@illinois.edu S4: Austin Warner Email: awarner5@illinois.edu S5: Diptarka Saha Email: saha12@illinois.edu |
||||||||||||||||||||||||||||||||||||
| E-learning specialist | Contact for all technical help: Yuk Tung Liu Email: ytliu@illinois.edu |
||||||||||||||||||||||||||||||||||||
| 3 Course Websites | 1. Course Webpage
This is where you'll find almost everything you need to know about the course: syllabus, calendar with lecture videos, exam schedule with study guides and practice exams, FAQs, etc. http://courses.atlas.illinois.edu/spring2020/STAT200/ (short URL: go.illinois.edu/stat200) 2. LON-CAPA site All homework, surveys and bonus work are submitted and graded immediately on Lon Capa. http://www.lon-capa.uiuc.edu 3. Compass site All grades and announcements are posted on Compass https://compass2g.illinois.edu (Lon-Capa's gradebook is confusing so always check your grades on Compass.) |
||||||||||||||||||||||||||||||||||||
| Course Materials |
|
||||||||||||||||||||||||||||||||||||
| Class Time |
All Sections -- No assigned meeting times. Watch lecture videos on calendar. Just click on the day and you'll be able to see the lecture. |
||||||||||||||||||||||||||||||||||||
| Zoom Office Hours | See Compass for Schedule and Information. | ||||||||||||||||||||||||||||||||||||
| Technical Issues |
If you experience a glitch in Lon Capa/Compass, first, try logging out
and logging back in.
If this doesn't work, email our tech expert, Dr. Yuk Tung Liu ytliu@illinois.edu describing the problem. Please make sure to include a screenshot of the error in your e-mail. |
||||||||||||||||||||||||||||||||||||
| Homework Schedule |
Homework is due on Tuesdays and Thursdays and R assignments are due on Fridays (see calendar) on Lon-Capa at 11:59pm. Ask questions on Lon Capa discussion boards and if you need more help, don't hestitate to come to the office hours at 703 South Wright St (2nd floor). (No late hw accepted but lowest 5 hw scores dropped) |
||||||||||||||||||||||||||||||||||||
| Exam Schedule | There will be 2 evening exams and a Final. See Exam Schedule for dates, times and locations. | ||||||||||||||||||||||||||||||||||||
| Grade for Required Work |
Click here for a grade calculator. Grade for required work
Overall Grade is Translated into a Letter Grade as follows:
|
||||||||||||||||||||||||||||||||||||
| Bonus Work |
Bonus Points — You may earn between 0 and 100 Bonus Points.Everyone may earn between 0 and 100 Bonus Points. Every bonus point earned helps your overall grade, but even if you do no bonus work, you can still get 100% for the course. In other words, bonus points can only help you. Bonus points are extra credit.Bonus Points (100 total bonus points): 1. Pre-Lecture Bonus problems 30 bonus points 2. Completed Notebook 40 bonus points 3. Lon Capa Surveys 30 bonus points Descriptions Pre-Lecture bonus points There will be short pre-lecture videos posted on Lon Capa followed by a few questions. The pre-lectures are designed to give you a preview of the basic concepts you'll see in the actual lectures. Completed Notebook You will take a short video of yourself flipping through the notebook (like this) and post it on Google Drive or Youtube. You'll then submit a link to it on Lon-Capa (due May 15). You'll get full credit if you have all the pages from lecture filled in. Here's a list of the pages you may skip: All summary pages, top of 9, top of 10, 27, bottom of 30, 35, 41,50, 55, 70, 92-101, 197 and 220. All the other pages are required. If you're missing 4 or more of the required pages don't bother to turn in the notebook because you won't receive any points. Lon Capa Surveys There will be 5 surveys (see the course calendar for due dates). Each survey is worth 6 bonus points. The surveys are all anonymous. Lon Capa just records whether or not you submitted a survey, not who submitted which answer. You must answer every question on the survey to get the 6 points. *Bonus points can only help you. You can still get 100% in this class without doing any bonus work.  Suppose at the end of the semester you have a 75% average and you did 100% of the bonus work. 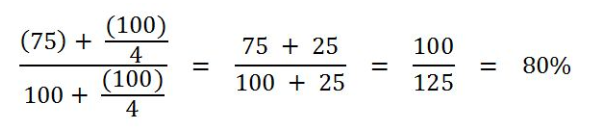
So your grade would be raised from a 75% (C) to an 80% (B-). |
||||||||||||||||||||||||||||||||||||
| Couse Outline |
Study Design - observational studies vs. randomized experiments, why randomized controls are key, what the possible confounders in observational studies are. Descriptive Statistics - mean, median, SD, histograms, box plots, normal curve, etc. Probability - multiplication rule, addition rule, conditional probability, Bayes rule Statistics for Random Variables - expected value and Standard error of chance processes, probability histograms and convergence to normal curve. Focus is on developing simple chance models (box models- drawing numbers at random from a box) that more complicated sampling processes can be translated into. Sampling and Statistical Inference - using sample means and percents to estimate population means and proportions, and attaching margins of errors to our estimates by computing confidence intervals. Why randomized sampling is key. Significance Tests - one sample and two sample Z-tests and t-tests and chi-square tests for goodness of fit and independence. Focus is on understanding how these tests depend on chance models. Experimental Power - Type I and II errors and the Power of Significance tests. Simple Linear Regression - correlation coefficient, regression equation, etc. Inference for Simple Linear Regression - Understanding the Simple Linear Model and Assumptions, Confidence Intervals and Significance tests for the Slope, Analysis of Variance for regression, etc. Binary Variables in Multiple Linear Regression - Causal Inference, Controlling for likely Confounders by including them as covariates in the regression model. Interactions between Binary and Quantitative variables . Models with 2 binary predictors. Multiple Regression with Quantitative X's - 3-D scatter plots and interpreting slopes graphically, Interactions, F-tests for overall regression effect and t-tests for slopes. Re-randomization Methods - Randomization Tests to calculate p-values for ANOVA and regression. ANOVA for Comparing Group Means Transformation of Variables- Fitting a Linear Model to non-linear data, log and square root transformations Logistic Regression -The log odds equation, making predictions and interpreting the slopes, the odds ratio, multiple logistic regression, maximum likelihood methods to estimate the slopes. Non-Parametric Statistics- Transform data into ranks to compute p-v values using Wilcoxon Mann-Whitney test (rank sum or U stat), Kruskal-Wallis test and Spearman's Rank-Order Correlation Coefficient |